
Greetings to all!
Mechanical trading systems are as old as the markets. With the development computer technologies and the Internet in the 20th century, it has become possible to trade without leaving home, and at the beginning of the 21st century, with the advent of MetaTrader, even in automatic mode. Resources of a modern desktop personal computer allow to implement any, even the most sophisticated, algorithms and MetaEditor integrated in the MetaTrader terminal enables to write a robot even a person who knows little about programming. As a result, a paraforex market is filled with various offers to buy the miracle EAs and some of them are really worthy of attention. But how to understand whether to use one or another forex EA on real accounts? Today I’ll tell and show you how to test a trading robot on historical data using MetaTrader 4.
Preparation for Testing
We won’t discuss how to install Advisor in the terminal today – there is a corresponding article in the blog for this purpose. Let’s assume that we have already installed the Advisor. Now, we need to think about the quotes that you will use. Most brokers don’t have their own historical data, except for Alpari and Dukascopy, while the rest use the quotes provided by MetaQuotes. I hesitate to make the flat assertion that these quotes are suitable for all tests because they have very low quality (there are many gaps, errors and inaccuracies there). How to download quotes provided by Dukascopy is a topic of a separate article; furthermore, it isn’t easy for a novice trader. Therefore, we’ll download the terminal from Alpari to test EAs. To your attention! To gain an access to the historical basis of Alpari’s quotes, you must be connected exactly to the real account in the terminal! Since recently, the broker doesn’t provide its basis for quotations for the owners of demo accounts.
It is because of differences in quotations that tests of the same adviser on the same pair with the same settings under otherwise equal conditions is likely to be differ, and sometimes greatly.
First of all, we need to set up something, for which we will go to the Tools tab -> Options or click Ctrl+O.
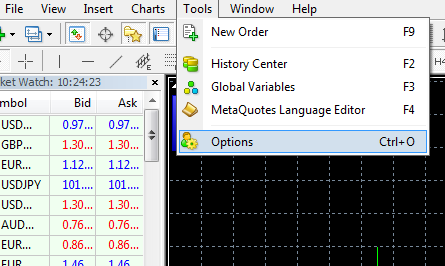
A window with the terminal settings will appear:
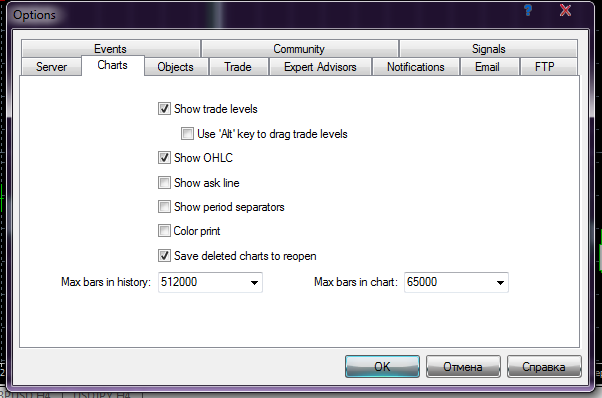
Select the Charts tab, and fill in the fields “Maximum bars of history” and “Maximum bars in the window” as shown in the picture above (by default, 65,000 bars).
Open the Tools tab -> History Center or click F2 to make the quotes of the required pair become available in the terminal for testing.
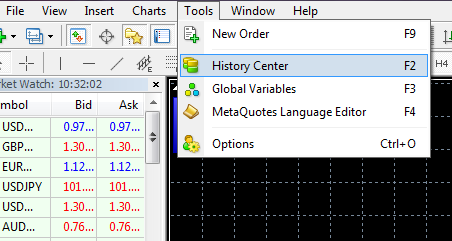
The following window is opened:
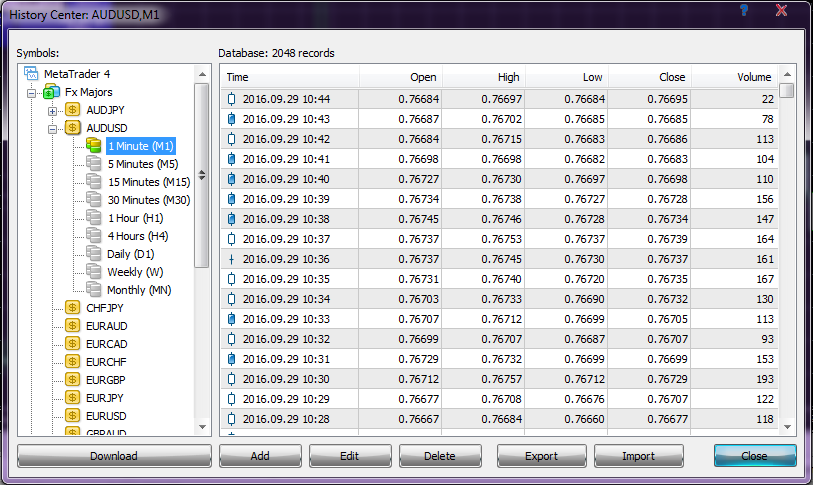
Choose the necessary pair and the M1 timeframe and click the Download button. The quotes will be loaded after a while; close the terminal and open it again. Go back to the archive and click with the left mouse button several times over the M1 timeframe of the required pair until the battery imaged near the timeframe changes its color from gray to yellow-green. Then click with the mouse through the remaining periods so that the quotes calculate for them as well. If you want to test an EA on several currency pairs, upload quotes of the required currency pairs. Close the terminal and open it again. Then re-enter the archive of quotations and go through all periods of a desired pair by clicking with the left mouse button on each of them several times. All these shamanic actions are necessary in the latest versions of the terminal, as the quotes are often loaded incorrectly. The preparatory stage is completed thereon.
Terminal Tester. Main Functionality

So, to begin testing the EA, open Strategy Tester or press Ctrl+R.
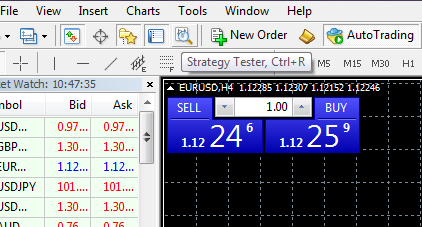
Such a panel will appear at the bottom of the terminal:
Let’s turn our attention to each function in detail.
The first thing you will see on the top left of the panel is the Expert Advisor/Indicator Switch:
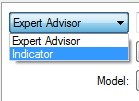
There is an opportunity to look at the operation of the indicators in a visual mode (which will be discussed below) in new builds of the terminal. It should be said that such possibility had been before, but unofficially. Now, a separate button is assigned for testing indicators.
So, choose Expert Adviser.
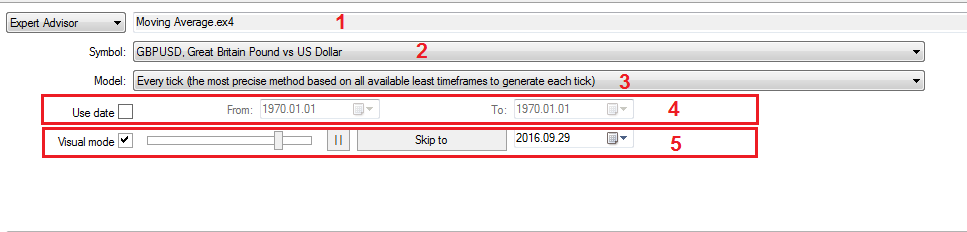
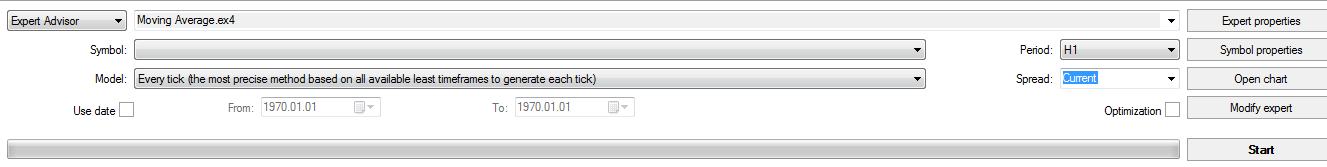
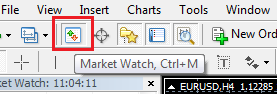
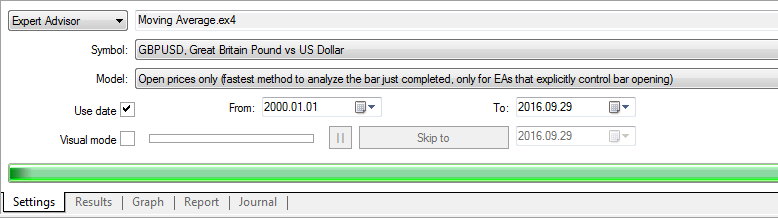
There is a drop-down list of available for testing EAs under number 1. Here, you will find only those EAs which are downloaded to your terminal. There is a drop-down list of currency pairs under number 2; you should select the desired one. Don’t forget to upload quotes for it to the quotation archive. If you suddenly couldn’t find the desired pair in the list, but you are sure that the broker provides it for trading, initiate the Market Watch or press Ctrl+M:
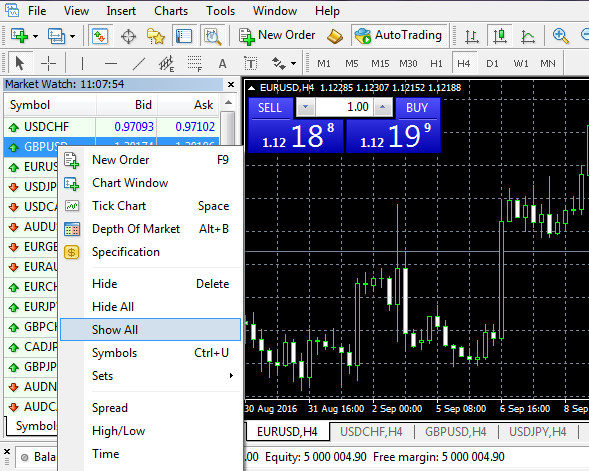
Next, click with the right mouse button directly in the navigator window and choose “Show all”:
Now, we’ll focus a little more in paragraph 3. Here we can select a desired for us model for testing. For qualitative testing a trading strategy, it’s important to choose the appropriate way of modeling the development of price bars. Three alternatives are available in total:
1) On opening prices (it’s the fastest method used on the formed bars just for EAs with a clear control of the bar opening)
It carries out a rough evaluation of the strategy. Only one tick is generated in each candle. The advantage is that it’s the fastest way of testing. In this mode, the bar opening is modeled first (Open = High = Low = Close; Volume = 1) that allows the EA to accurately identify the end of forming a preceding bar. Testing the expert starts namely on this incipient bar. The next step shows the fully completed current bar.
2) Control points (it’s a very rough method based on the nearest smaller timeframe; you shouldn’t take into consideration its results)
The method of modeling control points is intended for rough estimation of EAs trading within a bar. For this method, you should have historical data of the nearest smaller timeframe. In some cases, the available data of the smaller timeframe don’t completely cover the time range of the timeframe tested. If there is no data of a smaller timeframe, the bar development is generated based on the predefined wave templates.
As soon as history data of a smaller timeframe appear, the interpolation is applied to these new data. However, the specific existing OHLC prices of the smaller timeframe serve as control points. In most cases, experts testing results according to the control points method may be taken into consideration only as estimative but not as final. These results have an intermediate estimated nature.
3) All ticks (it’s the most precise method based on all available smaller timeframes)
This is the most accurate method of modeling prices within a bar. In contrast to the “control points”, this method uses for generation not only data of the nearest smaller timeframe, but also all available smaller timeframes. In addition, if there are data of more than one timeframe at any time range at the same time, then the data of the smallest timeframe are used for generation. As in the previous method, control points are generated on the basis of OHLC data of the smallest available timeframe. To generate the price action between control points, the interpolation is also used based on the predefined wave templates; that is why it is desirable to have minute data covering the entire range of testing. It is possible that several similar ticks are generated in succession. In this case, duplicated quotes are filtered, and the volume of the last of such quotations is fixed.
When testing on all ticks, the volume of ticks having been generated can be quite large, so the terminal can consume a lot of resources.
To test the EA, we should always choose the “All ticks” method. Yes, this is the slowest, but the most reliable method as well. Many traders use the control of closing a bar in their EAs, i.e. specially waiting for opening a new candle and opening of orders occurs only at this moment. But often EAs use stop losses, take profits and trailing stops, which can trigger at any time inside a candle. The method “on opening prices” can only be used by those advisers which don’t use trailing stop, stop loss and take profit, but open and close positions at the opening of a new candle, and there are very few such advisors.
Paragraph 4: Use date. Enter a check and select the desired start and end dates of testing. If the check is not entered, testing is conducted throughout the history of quotations loaded into the terminal. The tester will not be able to perform testing on the period which contains no quotations in the archive of quotations, so you will not be able to carry out the test since 1300 year, if you have no quotes for this period.
Paragraph 5: Visual mode. We’ll discuss it later.
There are the following settings on the right of the tester panel:
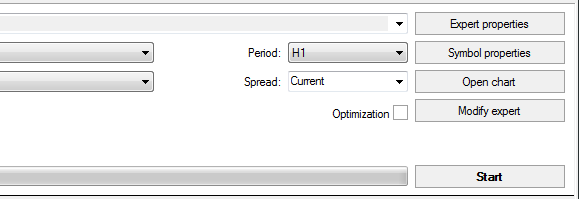
Period: A choice of timeframe for testing the EA. All timeframe up to D1 are available for testing, except W1 and MN1. In addition, if you didn’t download the quotation story for the desired timeframe, you cannot test it.
Spread: You can set any value or use the current spread on the pair. This is done for convenience; for example, the current spread is usually overestimated at night and on weekends, and if you are testing the adviser at that time, it makes sense to set the spread manually. If you have selected the current spread, the test results may be very different depending on the time of day and day of the week, especially when testing on all ticks.
The Modify Expert button is only available if you have the source code of the EA (a file with the .mq4 extension). It opens the advisor code editor where you can make the necessary changes of the EA.
The Open Chart button opens a chart with indicators applied on it and transactions made by the EA during the test (you can press it after the test having performed).
The Symbol Properties button
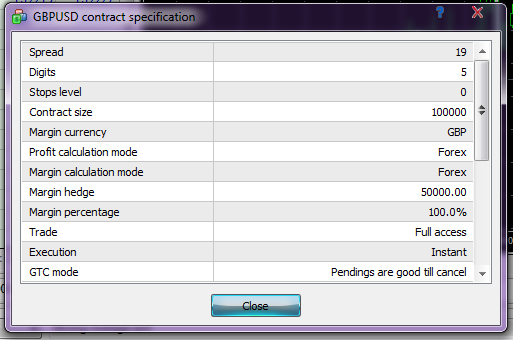
We cannot change anything here; it’s just reference information on the used currency pair.
The Expert Properties button
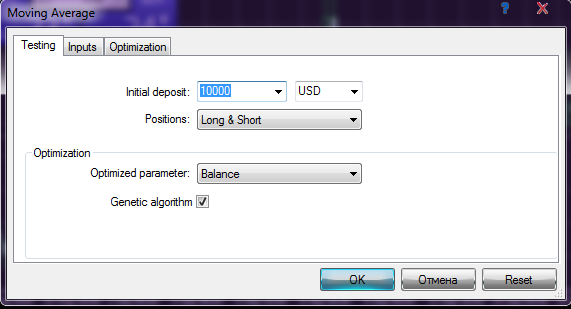
By clicking on the button you will see a window above. There are three tabs on the window: Testing, Inputs and Optimization.
The Testing tab
Here, you can enter the deposit used for testing and the deposit currency. Also, if desired, you can choose the direction of trades, for example, to allow the EA to trade only Buy or Sale. Optimization settings and the Optimization tab won’t be considered in the course of this article.
The Inputs tab
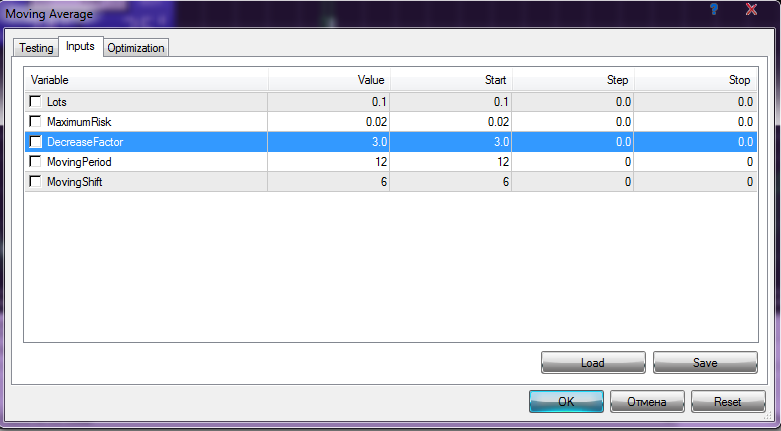
There are all control variables and settings of the EA here. By the way, the window is scalable: if you pull its lower right corner with the mouse, you can increase or reduce its size. Configuration files with the *.set extension are often supplied with EAs usually. And most commonly, each pair is supplied with its own configuration file. To download the correct settings for the desired pair, click the Download button and select the desired file. Usually, after the EA installation in the terminal, the settings don’t appear to be in the correct folder. After clicking the Download button, we turn out to be in the tester folder (in my case, it is C:\Users\Silentspec\AppData\Roaming\MetaQuotes\Terminal\FE03BE71CD8F9E8F4C70E0FDAFC997E5\tester). If there are no required files there, go to the folder FE03BE71CD8F9E8F4C70E0FDAFC997E5\MQL4\Presets; the files most likely to be there. So, select and download the appropriate configuration file. Having downloaded it, we should find the money management parameters for the EA and set a fixed lot of 0.1 – in this case, every dollar of profit or loss will be equal to 1 old point. I’ll tell you below, for what it is used.
Expert Adviser Testing. Test Results

Now we are ready to test. Check the settings once more and click the Start button. After some time, the test will be carried out, and we will be notified with a beep similar to that one generated by children’s rubber toy with squeaker.
Now, it’s time to look to the bottom left corner of the tester:
Here we can see the Settings, Results, Graph, Report and Journal tabs.
A list of all the trades made by the EA during the test is available in the Results tab.
You can admire the yield curve of the EA in the Graph tab.
If the EA hasn’t made any trade, you should look at the Journal tab. You will find in it a description of everything that happened during the test. The EA is likely to have something error. You can look for interpretation of an error number in the Error Codes section.
All statistics work of the EA on the selected time period is available in the Report tab:
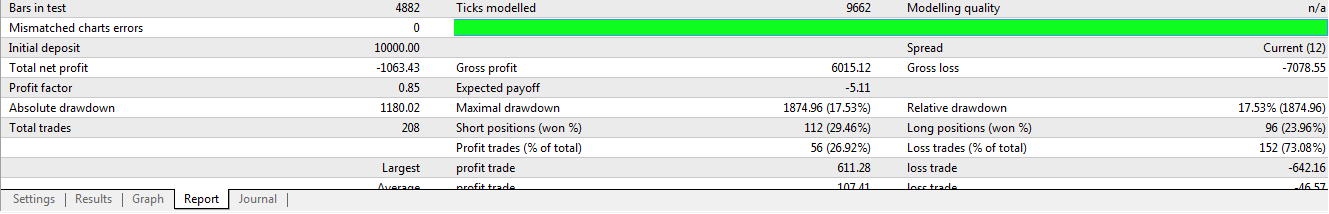
Bars in test: The number of bars in history. It shows the depth of history based on which the simulation was carried out.
Ticks modelled: The amount of ticks simulated. It shows the size of the modeled sequence. Each record of sequence is a state of a bar (OHLCV) at a particular time. Depending on the timeframe, the simulation method and the availability of historical data for smaller timeframes within a bar, a different number of states of the bars can be simulated.
Modelling quality: The quality of the simulation.
Mismatched charts errors: Errors arising in the tick simulation on different timeframes. If there is even one such error, you should delete the entire history from the terminal and download it again. To delete it, click File -> Open Data Folder -> A window with a folder of the terminal will open -> Open the History folder -> Select the desired for us type of account (that one you are using at the moment) -> Close the terminal and delete all files with the *.hst extension. Then download quotes in the quotations archive once more.
Panel indicating quality of quotations (Mine is green, so for example, I’ve found other one on the Internet):

The grey color indicates missing quotes. The red color indicates quotes only of the current timeframe. The green color indicates that quotes of the previous periods which are available as well, with the brighter green color indicating availability of quotes on smaller timeframes. With the availability of the M1 timeframe, the indicator will be bright green like mine is.
Initial deposit: The deposit, which was used in testing.
Spread: The spread, which was used in testing.
Gross profit: How much has been earned during the EA’s trade.
Gross loss: How much has been lost during the EA’s trade.
Total net profit: This is a profit that has been earned by the EA during the predetermined period. If the test was made with the 0.1 lot, this profit in the deposit currency is equal to the number of the old points earned. The same is true for all other parameters specified in the currency. Total net profit = Gross profit – Gross loss.
Profit factor: The profitability shows the ratio between the gross profit and gross loss. It is calculated by the formula: Profit factor = Gross profit/Gross loss.
Mathematical expectation of the profit: Mathematical expectation of the profit.
Absolute drawdown: This is a difference between the initial deposit and the minimum value of the balance in the testing process.
Maximum drawdown: This is a maximum difference between one of the highest peaks of the balance chart and the following lowest peaks.
The following figure shows the numbers of the main stages of the maximum drawdown changing in the testing process. The final value of the maximum drawdown is marked with the thick arrows.
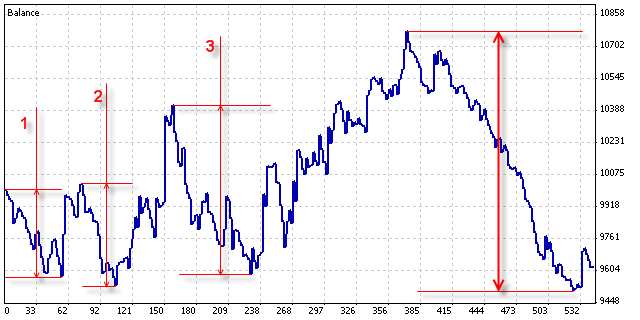
Relative drawdown shows the ratio between the maximum drawdown and the value of the corresponding highest peak.
I think the rest of the test data, such as average profitable trade, the maximum number of consecutive losses and so on, are quite clear and doesn’t need an explanation here.
If you click on the report with the right mouse button, you can save the report as an html file:
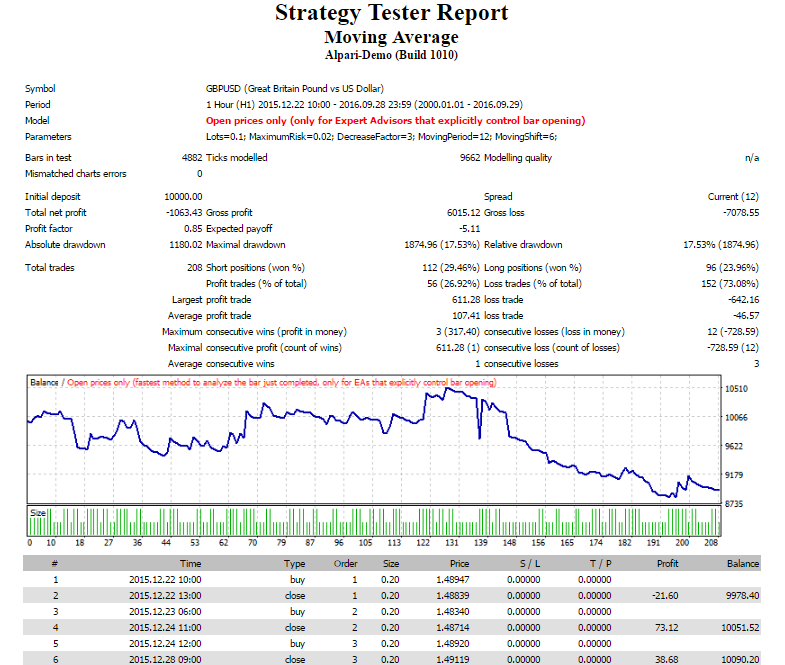
The main report data on the conditions of testing – a period, a currency pair, a test model, the EA’s parameters and so on – are presented above. The statistics data of testing and a chart of the yield curve are presented below. And then, there is a list of all completed transactions presented as a table.
Visualization Mode

This mode provides the ability to literally see in the accelerated mode how the EA would work in the past in the changes of quotations having taken place. For example, if the signals for enter and exit of the EA are based on the signals of a particular indicator, you can set the desired indicator on the visualization chart and then the opening and closing of transactions will be even more evident.
In other words, visualization helps to understand and feel the logic of the EA algorithm, as everything will happen before your eyes.
In addition, the visualization is also used when someone want to see the origin nature of passage of the EA through a particular site (the momentum of beginning a losing streak or, on the contrary, the most profitable period).
By trial running the robot in the visualization mode, you can understand how it works and you will know what to expect from it in the future. This is a very useful tool, especially for EAs developers.
Conclusion

The principal functionality of the strategy tester in MetaTrader 4 and features of quotes downloading were reviewed in this article. We also met with the results of testing the EA and visualization mode of testing. I want to note that this is only the basics of the work with advisers. The adviser testing method discussed in the article is suitable for advisors on timeframes of H1 and higher. For scalpers working on smaller periods, this test method is poorly suitable, and it has mainly informative nature. If you are going to make with the help of advisers, you should also master the optimization of them. It’s also useful to get a deeper knowledge of the testing and optimization EAs with higher modeling quality, which is unfortunately inaccessible in the standard version of the terminal.
Sincerely yours, Pavel
Tlap.biz


